ppPLUS Solutions
Solutions by ppPLUS Experts for your needs.
Introduction
How to Improve Your Business Results Significantly Using Margin Variance Analysis (MVA)? Is your refinery, petrochemicals or any other production plant making less actual financial margin than originally planned or aimed for? Then execute a Margin Variance Analysis (MVA) which describes in detail WHERE exactly the deviation is caused. Is it a price effect, deviations in supply and/or demand, or the capacity of the process units, or … all of the above?
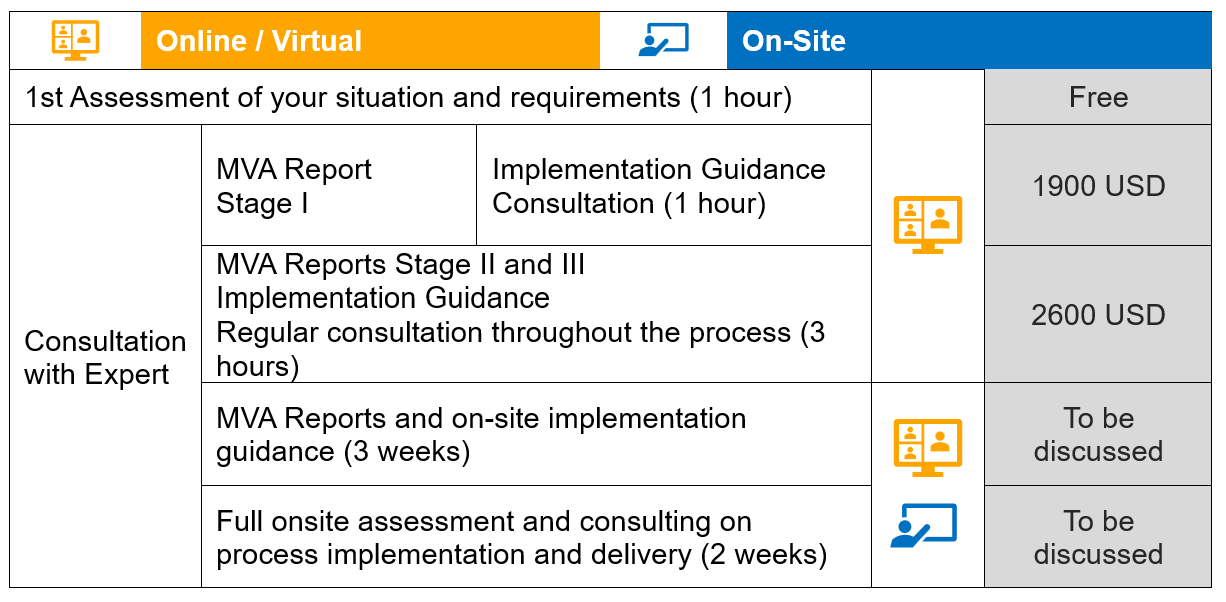
ppPLUS-Solutions MVA-Service can be tailored exactly to your requirements. You can determine and configure the individual Service Elements you want to combine.
Decide on implementation with internal resources and our guidance with online tools. Or a hybrid model with onsite support.
- Proven guidelines and assistance for the implementation of the MVA Process
- Step-by-step guidance in setting up valuable analysis-tools in Excel (Advanced Model Waterfall-Graphs)
| MVA Report Stage I | MVA Report Stage II | MVA Report Stage III |
|---|---|---|
| Report describes a detailed process for reporting variances between the planned and actual Gross Refinery Margin (GRM), the so-called Margin Variance Analysis (MVA), which is part of the refinery ’backcasting’ process. This includes Background, Purpose, Basic Process, Types of Causes, Roles & Responsibilities. |
Building on MVA Stage I, this report is introducing and explaining in depth the required instruments for analysis. This includes Data Required, Bar Chart Analysis, Trend Analysis, Case Assumptions.This includes Data Required, Bar Chart Analysis, Trend Analysis, Case Assumptions. |
Full suite of reports for presentation to (top) management assisting the decision making for corrective actions. Includes a template for a ‘Refinery Monthly Backcasting Report’ aiming to present monthly refinery backcasting results to (top) management appropriately. |
| 26 Pages | 15 Pages | 15 Pages |
|
|
|
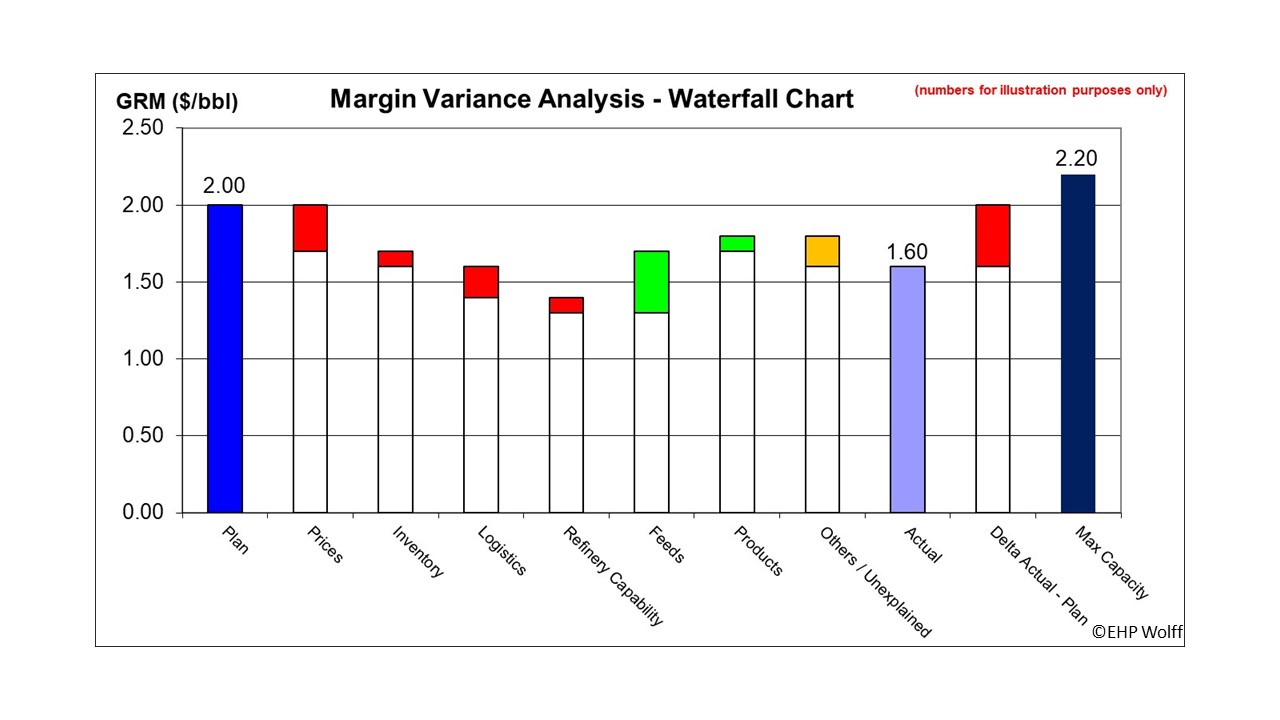
Waterfall Chart
The Waterfall Chart is a proven and valuable tool for performance analysis and identification of root causes. The MVA consulting will provide you in-depth guidance to set-up the needed (waterfall-) analysis tools.
MVA Components Configuration
Please contact us for a package deal with an attractive discount.
Delivery
ppPLUS-Solutions MVA consultation will be performed by an Expert who has completed already over 60 MVA studies in 30 years of experience.
Categories
Rate
- Value
- 1900.00 USD
- Comment
- Please see Service-Description for details
-
This Service includes FREE Consulting (see Comment/Description)

Explore our services today!
Click the button below to enquire about this Service and discover how we can tailor our expertise to meet your needs. (Service ID: 22)