The new podcast from ppPLUS. Join industry experts finding strategies for today's challenges.
The new podcast from ppPLUS. Join industry experts finding strategies for today's challenges.
The new podcast from ppPLUS. Join industry experts finding strategies for today's challenges.
The new podcast from ppPLUS. Join industry experts finding strategies for today's challenges.
The new podcast from ppPLUS. Join industry experts finding strategies for today's challenges.
| Organization | Products | Technologies | Mass Balance |
|---|---|---|---|

Corporation
|

Product-Structure
|

Processes
|

Mass Balance
|

Entity
|

Main-Product
|

Technology Types
|
Mass Balance Chart
|

Shareholding
|
Sub-Product
|

Technologies
|
Import
|

Interests Map
|

Technology-Unit
|
Production
|
|

Site
|
Consumption
|
||

Site Indicators
|

Visualization
|
||
|
Sites Map
|

Utilization
|
||

Asset
|

Scenario Management
|
||

Asset Unit (Process Units)
|

Margin Management
|
||
| Focus Modules | Other | Networking | Analytics |

Refinery Module
|
Indicators
|
Imports (Feedstocks)
|
|

Hydrogen Module
|
Production by Product, Site...
|
||

Sustainability Module
|
|||

Solutions Module
|
ppPLUS models all organizations as they can be found in corporate structures. The Corporation is the Brand, defined by the Entities they are operating in. A Corporation can only be created on top of an Entity, the "Holding-Entity". A Corporation is not essential for the modeling, but should be created, when certain criteria are met, like: publicly listed, public funding, major group of entities or other.
A Corporation can only be created based on a Legal Entity, which is not already linked to another Corporation.
Available Entities will be listed for selection as the Main Holding Company. If an Entity is not showing on the list, make sure, the Entity can be a Shareholder in addition to not being already allocated.
Name of Corporation
Copied from the Entity. Detailed location information should be managed in the Entity.
The Stock Exchange is defined in the Main Holding Entity (see Entity)
Internal Client Management. Use the default "Master".
Select the predominant industry the Corporation is operating in. Contact the Sysadmin, if a different Industry-Category is required.
| Industry | Description | |
|---|---|---|
 |
Chemicals | General manufacturer of Chemical Products |
 |
Industry Other | Industrial company with Chemicals Activities |
 |
Integrated Energy | Integrated Up- and Downstream Corporation |
 |
Investor | Major Investors or Stock Exchanges where Entities are traded |
 |
Logistics, Pipelines | Logistic, Supply Chain, Pipelines, Tankfarm operators |
|
Other | Other organizations or institutions |
 |
Petrochemicals | Predominantly Petrochemicals Corporation |
 |
Processor | Chemicals Processors and Customers |
 |
Recycling | Recycling corporations |
 |
Renewables | Corporations in the Renewables Industry |
 |
Refining | Corporation with predominantly Refining actitvities |
 |
Technology | Technology Providers |
 |
Trading | Trading companies for Refining- and Petrochemical Products |
 |
Upstream | Upstream company with some Refining or Chemicals Assets |
For later quantity-, energy-, and financial consolidation.
Subsidiaries show all the direct- and indirect Subsidiaries of the Main Holding Entity of the Corporation.
Percentages shown are the Equity share percentages of the direct Shareholder.
Step by Step Subsidiaries of any Entity can be viewed in the Shareholding Module of Entities.
Entities represent the registered legal entities in the market. Entities can have Shareholders or have Subsidiaries.
Identifying shortname of the Entity
The legal registered name of the Entity
It may be necessary to define Virtual Entities V, in situations, when the real Entity-Setup is unknown, or for purposes of creating a virtual shareholding entity, to combine two entities, see Technology Owner
Capture accurate localisation data
Codes to map the location of the Entity.
The Geocodes can be obtained from (Google-) maps. The function is available when Entity Name, City and Country are entered. Click Button "Get Geocode", which will open a new tab with Google-Maps, showing the location based on the information provided.
Copy the Latitude-/Longitudes codes into the dialogbox opened.
The official registration number of the Entity in the respective government registry.
If the Entity is publicly traded, select the main Stock Exchange Entity, where the stocks are listed.
New Stock Exchange Entities can be created, using Industry "Investor"
Stock-Exchange registration number. ppPLUS will display the Shareprice (using Google), based on the combination of Stock-Exchange and Index-Number.
Select logo of the Entity/Corporation. If logo is not available, email to SysAdmin.
The Entity may not be the responsible Operator of its manufacturing/production. Select the Operator-Entity, if it is known.
Internal grouping of Entities by Client. (use the default: Master)
Select Industry the Entity is operating in. This can be different from the Corporation the Entity belongs too. Also Entities inside a Corporation can have different Industry-Categorizations
| Industry | Description | |
|---|---|---|
|
Chemicals | General manufacturer of Chemical Products |
|
Industry Other | Industrial Company with Chemicals Activities |
|
Integrated Energy | Integrated Up- and Downstream Corporation |
|
Investor | Major Investors or Stock Exchanges where Entities are traded |
|
Logistics, Pipelines | Logistic, Supply Chain, Pipelines, Tankfarm operators |
|
Other | Other organizations or institutions |
|
Petrochemicals | Predominantly Petrochemicals Corporation |
|
Processor | Chemicals Processors and Customers |
|
Recycling | Recycling corporations |
|
Renewables | Producer of Renewable products |
|
Refining | Corporation with predominantly Refining actitvities |
|
Technology | Technology Providers |
|
Trading | Trading companies for Refining- and Petrochemical Products |
|
Upstream | Upstream company with some Refining or Chemicals Assets |
Default Unit of Measure or Currency for consolidation of the quantities, energy values, and financial values
| Status | Description | |
|---|---|---|
| A | Active | Entity and its functions can be edited by everybody. Entity results will show up in reports |
| L | Locked | Entity and its functions can only be edited by Entity-Manager. Entity results will show up in reports |
| A | Inactive | Entity de-activated. Results will not show up in reports |
| R | Remove | Entity is flagged for removal (Delete). Administrator can delete Entity, if there are no further dependencies |
| V | Virtual | Entity is virtual. Either to model an operation, which requires a virtual Entity, or the configuration data ist not known. |
| V | Not-Virtual | Entity is real. |
| P | Public | Entity is public and is included in all lists and calculations, depending on Status "Active" or "InActive". |
| P | Not-Public | Entity is not visible in all lists and not included in calculation of reports. |
| Lg | Logo allowed | No restrictrions on use of company graphics. |
| Lg | Logo not allowed | Use of Graphics limited/prohibited. |
| Sh | Shareholding possible | Company can operate as a Holding company. |
| Sh | No Shareholding | Company cannot operate as a Holding company. |
If deselected, results and information will not be shown in all the Views
Select to allow Entity for shareholding in other companies or be the main holding company of a Corporation
License rights may prohibit to show the Logo of the Entity or Corporation. Select to suppress Logo in Views of related Corporations/Sites/Assets etc.
List shows all the Legal Entities and all the linked Sites of the Entities. Not-Public Sites will not appear on this list. To access these sites, select the Entity and open the Site from the Sites-List in the Entity.
List is sorted by Industries. Entities of a single Corporation may be included in different Industry-Categories.
Short name and Legal name of Entity.
Flag of Country and mouseover shows also City. Writing the name of the country in the search field will only show Entities of this country.
Icon indicates, if the Entity is the Main Holding Company of a Corporation.
Lists all the Sites of the Entity, together with location information.
| Rating | Status | Description |
|---|---|---|
| / | Initialized |
Assets created, first available data on Imports or Production included. Does not require to be balanced Visualization Chart available |
| / | Advanced |
Model includes multiple Assets and selective Technologies. Imports of Feedstock, Consumption of Intermediates and Production of Finished Products, but data missing or not complete and not balanced.
Visualization Chart available |
| / | Complete |
(Near) Complete Mass Balance Model with Imports, internal Consumptions, Finished Products Exports, Technologies and should be balanced.
Visualization Chart available |

The equity holders of the individual Entities can be assigned in the Shareholding-Function, Navigation-Bar: Equity.
Shareholding can only be created upwards. Select the Entity and define its Shareholders.
Shareholding can be modeled by periods, historically and forward. Please make sure, the sum of the Shareholding-% by period does not exceed 100%.
Shareholding for a period can be below 100%.
ppPLUS allows to also include the percentage of shares listed on a Stock-Exchange. (See below: Multiple Shareholders)
Shareholder for selected Entity. Dropdown only lists Entities, which have the tag "Shareholding" in Entity-Settings.
Number between 0.1 and 100
Beginning date of Shareholding. If date is unknown, the best assumption should be made and commented in the Comment Field.
Default is December 2050, can be overwritten.
The Consolidation method is related to the Financial Consolidation, which can also be used for consolidation of the product portfolios.
Type of Consolidation by the Shareholder:
Unknown - Consolidation method not known
None - Shareholer does not include results of Entity in the Financial Consolidation
Equity - Shareholder consolidates the result (Profit/Loss) as per Equity
Proportionate - Shareholder consolidates each line of the Balance Sheet as per Equity
Full - Shareholder consolidates the full result of the Entity
Applicable, when the Entity includes several Shareholders. Most likely, when the Shareholder is a Stock Exchange.
Comments on Periods and certainty of the data.
List shows the direct Subsidiaries of the Entity. Next level indirect Subsidiaries can be viewed, where a drilldown arrow is visible.
Multilevel Subsidiaries can be viewed from Corporation Level.
The Interests Map is a dynamic display of the Site/Entity and its shareholders or subsidiaries. By clicking on the markers you can select to move to the next level of shareholders or subsidiaries or view the Mass Balance (Graph or List) of a site.
| Markers | Status | Action |
|---|---|---|

Entity Marker |
The Entity Marker shows the location of the Entity being mapped. Entities can be of various nature, for example a controlling company, an investor, a wholly owned-subsidiary or a stock exchange. |
Click on the Entity marker to see a pop-up with a link to the Entity Details, showing full deatils of this Entity.. |
|
|
Pins of various colours show locations of Operating Sites associated with the Entity. These can be filtered on or off by using the filter list at top right of the map. |
Click on a pin to access Site Production Summary and Mass Balance information. |

Subsidiary Marker |
The Subsidiary Marker shows the location of a subsidiary interest. |
Click on a Subsidiary Marker for a pop-up menu with a link to full information about this entity, and a link which sets this subsidiary as the focus Entity of the map. |

Investment Marker |
The Investment Marker indicates an investor or stock exchange. |
Click on an Investment Marker for a pop-up menu showing investment summary, a link to further details about the entity, and an Interests Map of this entity. |
The Entity's operations, it's manufacturing, logistics, admin or research functions are modeled in Sites.
Address fields are copied at the creation of the Site from the Entity, the Site is linked to. The fields can be overwritten.
ppPLUS allows to create Sites in different countries than the Entity resides in.
Specific markets, like the European Union, allow the creation of single
Entity-Companies (SE), running operations in multiple countries.
Sometimes the actual legal entity of the operation may not be known or does not exist yet for a project. For such cases it is possible to
create Sites in different countries than the Entity.
It is however strongly recommended to create new Sites from the actual (legal) Entity they belong to.
Please contact the
Sysadmin
, if a Site with multiple dependencies, like Assets, Mass Balances etc needs to be re-allocated.
This can be simply done, without re-creating the data.
Latitude- and Longitude- Geocodes are required if the Site is not declared Virtual.
The Button "Get Geocode" will open Google-Maps with the location information provided (Name, Country, City...) for the Site. Right-Click on the exact location, copy the Geocode and paste the value into the Dialog-Box opened.
A Site can be declared Virtual V, if the model requires to include virtual operations, like supply-sites or others.
A Site can be locked for editing to one Site Manager only. Users with Administrator-Rights can assign Site-Manager-Roles to Users with Collaborator-Rights.
The Unit of Measure for the consolidation of the Mass Balance quantities in the reporting
Information on the Site, in the Home-Communicator, in Reports is depending on the Public-Status P.
| Status | Description | |
|---|---|---|
| A | Active | Site and its functions can be edited by everybody. Site results will show up in reports |
| L | Locked | Site and its functions can only be edited by Site-Manager. Site results will show up in reports |
| A | Inactive | Site de-activated. Results will not show up in reports |
| R | Remove | Site is flagged for removal (Delete). Administrator can delete Site, if there are no further dependencies |
| V | Virtual | Site is virtual. Either to model an operation, which requires a virtual site, or the configuration data ist not known. |
| V | Not-Virtual | Site is real. |
Sites, together with the related Entity can be selected as Favourites and will appear on the Home-View for Quick Access. (requires Authentification) The selected Favourite-Site can be removed by selecting the -Symbol in the Favourite-Widget on the Home-View.
Sites can have individual Indicators, which describe major performance indicators in operations and environment.
New Indicators can be defined in Indicators. Please contact Sysadmin to create a new KPI.
The List shows the most recent Indicators for the Site.
Sites can have individual Indicators, which describe major performance indicators in operations and environment.
New Indicators can be defined in Indicators.
Indicator as created in Indicator Module.
Indicators can be defined by a Scenario. (Contact Sysadmin to create different Scenarios) Actual Scenario can be a result of an achievement. Outlook for a future planning.
The Period, (Year/Month) when the organization is planning to achieve the Indicator Value.
The Period, (Year/Month) until when the Indicator is valid.
The target-value. The Unit of measure of the Indicator is defined in Indicators.
Hyperlink to document or website, which describes and documents the Indicator.
World view of all the Sites created in the system.
| Markers | Status | Action |
|---|---|---|
|
|
Pins of various colours show locations of Operating Sites associated with the Entity. These can be filtered on or off by using the filter list at top right of the map. |
Click on a pin to access Site Production Summary and Mass Balance information. |
The Sites' Assets model the manufacturing plants, storage facilities, research, utility or admin functions required for the processing of the products.
Each Assets has at minimum 1 Unit, which further defines the functionality of the Asset.
Technologies applied in the manufacturing process define the structure of the Assets.
Typically an Asset has the category Processing, but can also be defined as a Utility, Research or Admin Category.
Additional information on the location of the Asset. The Asset may also reside outside the boundaries of the Site.
The Latitude(s), Longitude(s) fields allow to precisely place the location of the Asset inside the Site.
Useful for cost-allocation calculations or determination of depreciation periods.
The Asset configuration may be determined by the Technology used in the process.
A Licensor can be selected, if it is different from the Technology Owner.
The Technology cannot be changed or removed, if an Asset-Unit has been linked with a Technology-Unit.
Selector will determine, if future capacities (Utilization) is calculated on the Asset- or Unit-Level. (for future implementation)
Determines the Unit of Measure for the consolidation of the Asset-Capacity
Asset Units represent individual pieces of equipment, like furnaces or other chemical reaction units. Units allow to split the Assets (Plants) into separate processing Units.
Assets (Plants) can be configured accordingly to the Technology setup chosen.
Units can be created individually or grouped by the number existing in the plant.
Example: A plant consisting of 6 different furnaces, can either be configured with 1 Furnace-Unit, Quantity: 6; or alternatively with
6 Furnace-Units (Quantity: 1). This allows to apply different utilization-calculations (for future implementation).
Units can be categorized as In- or Out- Units, or both. This allows for simpler selection in the modeling process.
Example:A furnace is a typical Input-Unit, a product-fractionator an Output-Unit.
Asset Units can be used to create the supply-chain-linkage between Sites. The dropdown allows to select the source (Site) of the imported feedstocks (raw materials).
Products in ppPLUS are modelled in a hierarchical structure, organizing products by industry or origin and various product-categories.

Segments represent the industries, ranging from the refinery feedstock, agricultural products, forestry sourced materials, mining metals and minerals, to downstream sectors, such as pharmaceuticals, automotive, steel, glass, paper, with broader categories of refining products, as well as chemcial products encompassing organic, mineral and polymer products.

Main-Families split up the Segments by individual chemical product type, structure and/or origin.

Subfamilies add an additional product speciation based on function, usage, chemical form, structure or functionality.
Main Products group the Products (the actual product). Main Products allow also to select a generic product, if the Sub-Product is not known.
Example: You can choose Polyethylene, which is a placeholder for LLDPE, HDPE, LDPE or Other.
The table of Products to the right shows all the linked Products
of the Main-Product and identifies the Default-Sub-Product for the processing-steps if the specific Sub-Product is not known.
Each Main-Product requires one Sub-Product.
Each Main-Product is organized in 3 Categories:
Segments: Segmentation into Feedstocks, Refining, Chemicals and other follow-up stages.
Product Main Families: Dividing the Segments into major Families, like Chemicals -> Aromatics, Polymers...
Product Sub Families: Further categorzation of the Main Families: Polymers -> Commodity Plastics, Engineering Plastics...
| Status | Description | |
|---|---|---|
| A | Active | Main-Product is available for modeling and analysis in Mass Balances |
| L | Locked | Main-Product can only be modified by User with System-Admin Rights (to be implemented) |
| A | Inactive | Main-Product is not available anymore for selection in new Mass Balance. Check for alternative Product (to be implemented) |
| R | Remove | Main-Product is flagged for removal (Delete). Administrator can delete Product, if there are no further dependencies |
The Main- (and Sub-) Products default Unit of Measure, when the product is selected for the modeling.
Selection of the Physical State of the Product.
3 different Physical States are possible: Gas / Liquid / Solid
Value Chains link Products derived from a specific Building Block. A Main-Product can either be a Building Block or be a part of a Value Chain.
ppPLUS allows to link a Main-Product to two different Building Blocks.
A Main-Product cannot be a Building Block and be a part of a Value Chain.
Example:
Ethylene -> Building Block
Ethylbenzene -> Linked to Building Block I:
Ethylene and Building Block II:
Benzene
Main-Products can be defined as Building Blocks, to identify the Key Products for consolidation and avoid double count.
Example:
Ethylene (= Building Block) and Polyehtylene.
Sub Products represent the actual product which is required for modeling.
Industry specific name.
Abbreviation of the product for referencing.
Listing of alternative names, the product is also known as.
Tag fields for additional information.
Hyperlink to external Internet-Site which provides best information on the product.
| Status | Description | |
|---|---|---|
| A | Active | Product is availble for modeling and analysis in Mass Balances |
| L | Locked | Product can only be modified by User with System-Admin Rights (to be implemented) |
| A | Inactive | Product is not available anymore for selection in new Mass Balance. Check for alternative Product (to be implemented) |
| R | Remove | Product is flagged for removal (Delete). Administrator can delete Product, if there are no further dependencies |
Industry categorization organizations (see links on organization icons)
Chemical formulas subscript characters can be edited with sub tags. This field can be left blank.
Molecular Weight is a measure of the sum of the atomic weight values of the atoms in a molecule. The exact value is entered for Products of know molecular composition, e.g. C6H6 in case of Benzene. In case of complex mixtures such as Crude Oil types, or Sub-Product with a Molecular Weight distribution such as most Polymers, the default value 1 is entered.
The Freezing Point, which is the Temperature at which a Sub-Product solidifies under cooling, can be entered, but it is mostly relevant for Crude Oil, Oil Fractions and Liquid Fuels, since it is a critical determinant of the flowability and temperature usage window. This field can be left blank.
The Boiling Point is the Temperature at which a liquid Sub-Product vaporizes when heated up. It provides an indication about the Physical State of the Sub-Product depending upon environmental conditions such as Temperature and Pressure. This field can be left blank.
The Melting Point is the Temperature at which a solid Sub-Product becomes liquid when heated up. It provides an indication about the Physical State of the Sub-Product depending upon environmental conditions such as Temperature and Pressure. This field can be left blank.
The Specific Gravity of Crude Oil types is automatically calculated from the API value and required for Mass Balance calculation purposes, so that it is required for this class of Products; for any Sub-Product else than Curde Oil types, Specific Gravity is optional and the field can be left blank, but an informative Density value can be entered instead.
API Gravity is required for Crude Oil types (Liquid Feedstocks) as it is used to determine the Specific Gravity required for Mass Balance calculation purposes.
Sulfur Content is an informative value for many Feedstock types in all physical states (such as Coal, Crude Oil, Natural Gas), Refining Fractions and often Liquid Fuels. It should be entered if known but the field can also be left blank.
Main-Products have one or more Products. One is defined as the Default Sub-Product, which determines the selection in the process-modeling. The Default Sub-Product can be changed.
In the Documentation and Reference Communicator addtional information and links can be provided to describe and document the values being used for the properties or other specific information on the product.
A Process is identified according to its specific function such as the transformation, conversion or modification of a defined feedstock or of various inputs, a specific type of reaction, polymerization, refining or industrial process.
The Process Name is displayed at the top of the page after it is created in the Process field.
ppPLUS differentiates between below main Process categories:
A short description of the Process providing a moderate level of details to explicitly describe the role and function of the Process.
When relevant a hyperlink to a document from which the bulk of the information details provided in the Description are originating from.
A Technology Type differentiates more specifically the mode of operation of a specific Process or the type of conversion, transformation or modification effectuated. For example within the Process Category: Crude Processing, one finds the following Technology Types: Gas Oil SeparationPlant, Crude Desalting, Crude Stabilization, Crude Oil Receiving, Atmospheric Distillation and Vacuum Distillation. By the same token Polyethylene Polymerization Processes are differentiated between Polymerization of Ethylene according to the Gas Phase, High-Pressure, Loop Reactor Slurry, Solution, and Stirred Tank Reactor Slurry Technology Types. A technology Type is described according to the following criteria.
The Process, to which the Technology Type relates, is automatically presented.
A description of the Technology Type, providing a sufficient level of details to explicitly describe the role and function of the Technology Type, which can be edited in html format and with hyperlinks inserted into the text. In case of multiple sources a referencing format such as shown here[1],[2] is recommended.
When relevant a hyperlink to a document from which the bulk of the information details provided in the Description are originating from.
Widget shows a representative picture of the Technology Type such as a block flow diagram, a process flow diagram or a photo of a production plant.
A legend, citation and a hyperlink to the source of the picture can be added in the Copyright field.
Widget shows a representative video of the Technology Type such as a webinar, a process simulation or a film about an existing production plant.
A legend, citation and a hyperlink to the source of the video can be added in the Copyright field.
Widget lists the Technologies belonging to the Technology Type.
Technologies in ppPLUS are modelled in a hierarchical structure, organizing Technologies by the Type of Process, the industry they belong to, the type of inputs or feedstock, or the transformation, modification or conversion effectuated by the Technology.
Processes are organized in various categories depending on either the type of feedstock or input, the type of conversion, modification or transformation effectuated by the Process, and/or the industrial segment to which the Process belongs. The system is flexibly designed to be extended to various conversion industries beyond refining and chemical processes.
Within Process Categories, Processes are identified according to their specific function such as the conversion of a defined feedstock or input, a specific type of reaction, specific polymerization or refining processes, and more. The system is flexibly designed to accommodate various conversion and manufacturing processes throughout industrial sectors.
Within a Process, a Technology Type differentiates more specifically the mode of operation of a specific Process or the type of transformation, conversion or modification effectuated.
A Technology is typically assigned to a specific Owner, Licensor or Equipment Manufacturer. Technologies are used for creating models of Assets and Production Sites.
A Unit is a piece of equipment within a Technology that is effectuating a specific conversion, modification or transformation. For a Technology to be usable is creating Asset models, it must have at least one Unit to which the input(s) or feedstock is(are) fed to and from which one or more product(s) or output(s) is(are) produced.
Name of the Technology, typically a combination of the Name of the Technology Owner and Process type of Brand. This is generally self-defined.
Official Brand from the Technology Owner, that can be associated with a Trademark.
Selection of process according to the broad definition of Chemical Conversion or Combination/Separation Processes applied to Products.
Selection of the legal Entity of the Technology Owner. If the Technology is owned by 2 or more different parties (Entities), it is recommended to create a (virtual) Entity as a Joint Venture of the Technology Owners.
Geo-Marker opens map showing the global locations, where the Technology is licensed/deployed in Non-Virtual Sites and the Asset/Plant has production.
Activate, if the Technology is available for licensing.
Link to a document, or the website of the Technology Owner, where the Technology is described.
Widget shows a representative picture of the Technology Type such as a block flow diagram, a process flow diagram or a photo of a production plant.
A legend, citation and a hyperlink to the source of the picture can be added in the Copyright field.
Widget shows a representative video of the Technology Type such as a webinar, a process simulation or a film about an existing production plant.
A legend, citation and a hyperlink to the source of the video can be added in the Copyright field.
Widget lists the Units created for the Technology
Widget lists the Legal Entity and the Site (Manufacturing Location), where the Technology is in use, licensed to.
A Technology-Unit is a chemical processing or transformation equipment of the Technology, as defined in the Technology Configuration.
Shortname and Name, describing the Technology Unit.
When relevant a hyperlink to a document from which the bulk of the information details provided in the Description are originating from..
A description of the Technology Unit providing a sufficient level of details to explicitly describe the role and function of the Unit, which can be edited in html format and with hyperlinks inserted into the text. In case of multiple sources a referencing format such as shown here[1],[2] is recommended.
Widget shows a representative picture of the Technology Type such as a block flow diagram, a process flow diagram or a photo of a production plant.
A legend, citation and a hyperlink to the source of the picture can be added in the Copyright field.
Widget shows a representative video of the Technology Type such as a webinar, a process simulation or a film about an existing production plant.
A legend, citation and a hyperlink to the source of the video can be added in the Copyright field.
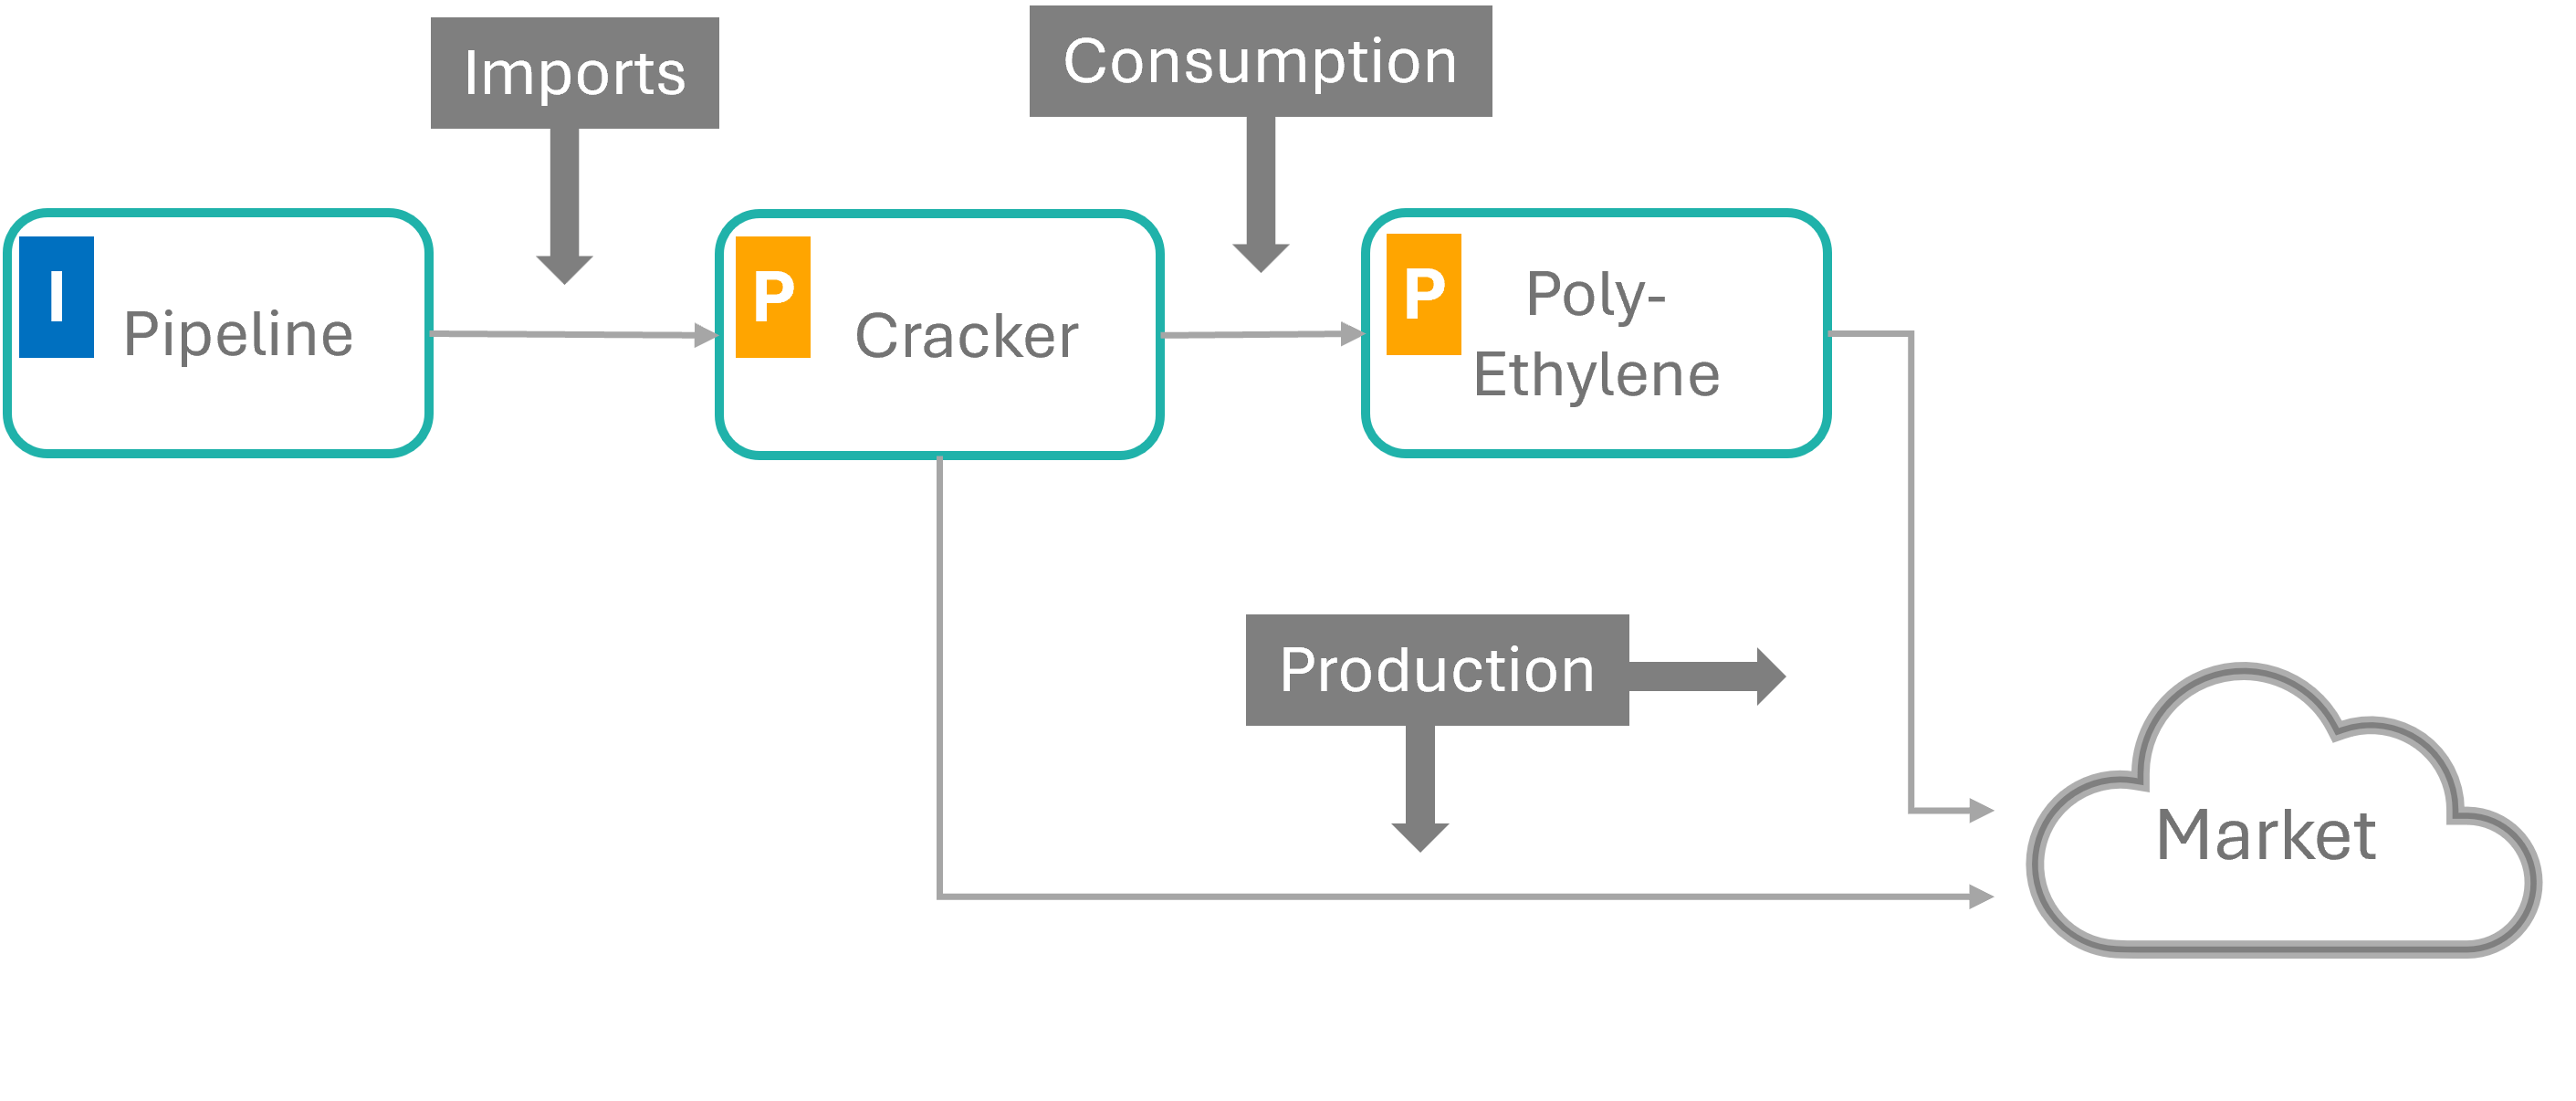
The Mass Balance report consolidates, in Metric Tons per Annum, Imports, Production and Consumption quantities of a Site. The report allows to analyze the product portfolio of an operation (Site).
Various drilldowns are available to understand the underlying processes and chemicals conversions.
Listing of the Imports, Production and Consumption in Metric Tons per Annum, per Site.
The list allows to view the Imports of raw materials, its Consumption in the Process, the conversion to intermediate or final Products.
The icons provide details of transactions, drilldowns on the processing by Asset or Product and which conversion rates are used.
Color codes differentiate the Products by Product Family.
Select from the Navigation-Bar to view or model Imports, Production or Consumption.
The Balancing-Indicator shows if the Import and Sales Quantities of the Site is in balance.
Unconsumed Imports or overstated Production lead to Imbalances and require further adjustments.
The ppPLUS Visualization Tool allows to display the Mass Balance of a Site in a graphical format. The tool provides a visual representation of the Mass Balance, which is easier to understand and analyze than the tabular format.
The visualization tool provides several categories to a) suppress or b) highlight the transactions in the graph.
The categories are defined in the Connector Categories and can be selected in the Mass Balance Visualization tool.
Please note: Production categories (Connectors) are only visible, if that Production is not consumed, i.e. it
is available for sale (Market).
Relationships between 2 Processing Assets are shown and can be managed with the Consumption transaction.
| Category | Symbol | Import | Production | Consumption |
|---|---|---|---|---|
| Default | D | Standard (Default) category | Standard (Default) category | Standard (Default) category |
| Side-Stream | S | Product flows, which are not for direct commercialization (Feature is not yet fully implemented) |
||
| Off-Stream | O | Selecting Off-Stream category will suppress the arrows for production of products, which are waste streams or similar. | ||
| Lightgrey | G | Color to categorize minor product flows | Color to categorize minor product flows | Color to categorize minor product flows |
| Red | R | Red color connector | Red color connector | Red color connector |
| Blue | B | Blue color connector | Blue color connector | Blue color connector |
| Green | G | Green color connector | Green color connector | Green color connector |
| Inner Asset | I | Highlights product flows within the Asset, no color categorization available | Highlights product flows within the Asset, no color categorization available |
Selecting the Core Product checkbox will show the label and the KTA of the product on the connectors.
If multiple products are combined in one connector, the label will show "Multiple products..." and the details can be seen by
viewing the Asset Mass Balance, click F.
The Utilization-Module is a forward planning tool for short- and long-term planning by Asset.
The platform provides the facilities to plan in detail future output, based on the Mass Balance Models which have been created before.
Multiple categories are available to include in the modelling all the internal and external factors, which impact the sites operation.
Beta-Phase
During the initial phase, the system allows to only create and edit Utilization-Rates (Months) of one Scenario, the Default-Scenario.
At a later state, the system will be opened, to use other Scenarios for Production-Modelling.
Assumptions
| Category | Description | Comments and Examples |
|---|---|---|
| Capacity | Default 100% (of the capacity defined in the MB). |
This should be changed, if the overall performance of the Assets is persistantly different (better or worse)
than defined in the MB. The MB may represent the original, historic Name Plate capacity, but modifications of the Asset have improved the performance. This applies also when aging factors worsen the performance. |
| Availability | Mostly external Factors impacting the Availability of the Asset. | Missing Feedstocks (Imports) or breakdown of the Utilities (Energy) have prevented for the Asset to run at full capacity. |
| Reliability | Internal technical factors impacting the performance. | For forward planning, a negative Reliability-% can express constraints on the Asset from varying technical issues, often based on historical data. |
| Operational | Factor allowing to capture consistent changes to the MB performance. | This category can be used together with 'Capacity', when the base Capacity level should be maintained and overall factors improving or decreasing capacity need to be captured separately. |
| Other | Category for any other reasons | In forward planning this category allows to capture for instance strategic impacts. Like investments in MB-/Configuration changes, impacting the performance. |
| Comment | Space for documenting the values applied. | Quite important, to comment why particular values were applied. |
The ppPLUS Margin calculations integrate the Mass Balances, Scenarios, Utilization Rates and Price Sets calculating a Financial (Margin) Model. The Margin-Dashboard calculates the USD Values for Revenues and Imports and resulting Margins.
See the explanations of Scenarios and Utilizations for the basics to create a Performance (Margin-) Model of the targeted operation.
In the Price Set Center you can Upload and Analyze Price Sets. Contact ppPLUS to support you in generating Price Sets.
Price Sets are linked with Price Versions, created by the Client.
Clients can manage own Price Versions (Price Sets), which can be flexibly used and managed for analytics and Margin Model generation.
The Margin Dashboard provides a US-Dollar Performance View (or different currencies, depending on the Price-Set) of the production outlook and the pricing- and costing views.
ppPLUS structures Mass Balance data-models in Scenarios. Scenarios are linked to the Clients. All Scenarios in the default client ppPLUS are public. Other clients can decide to manage their data in protected Scenarios.
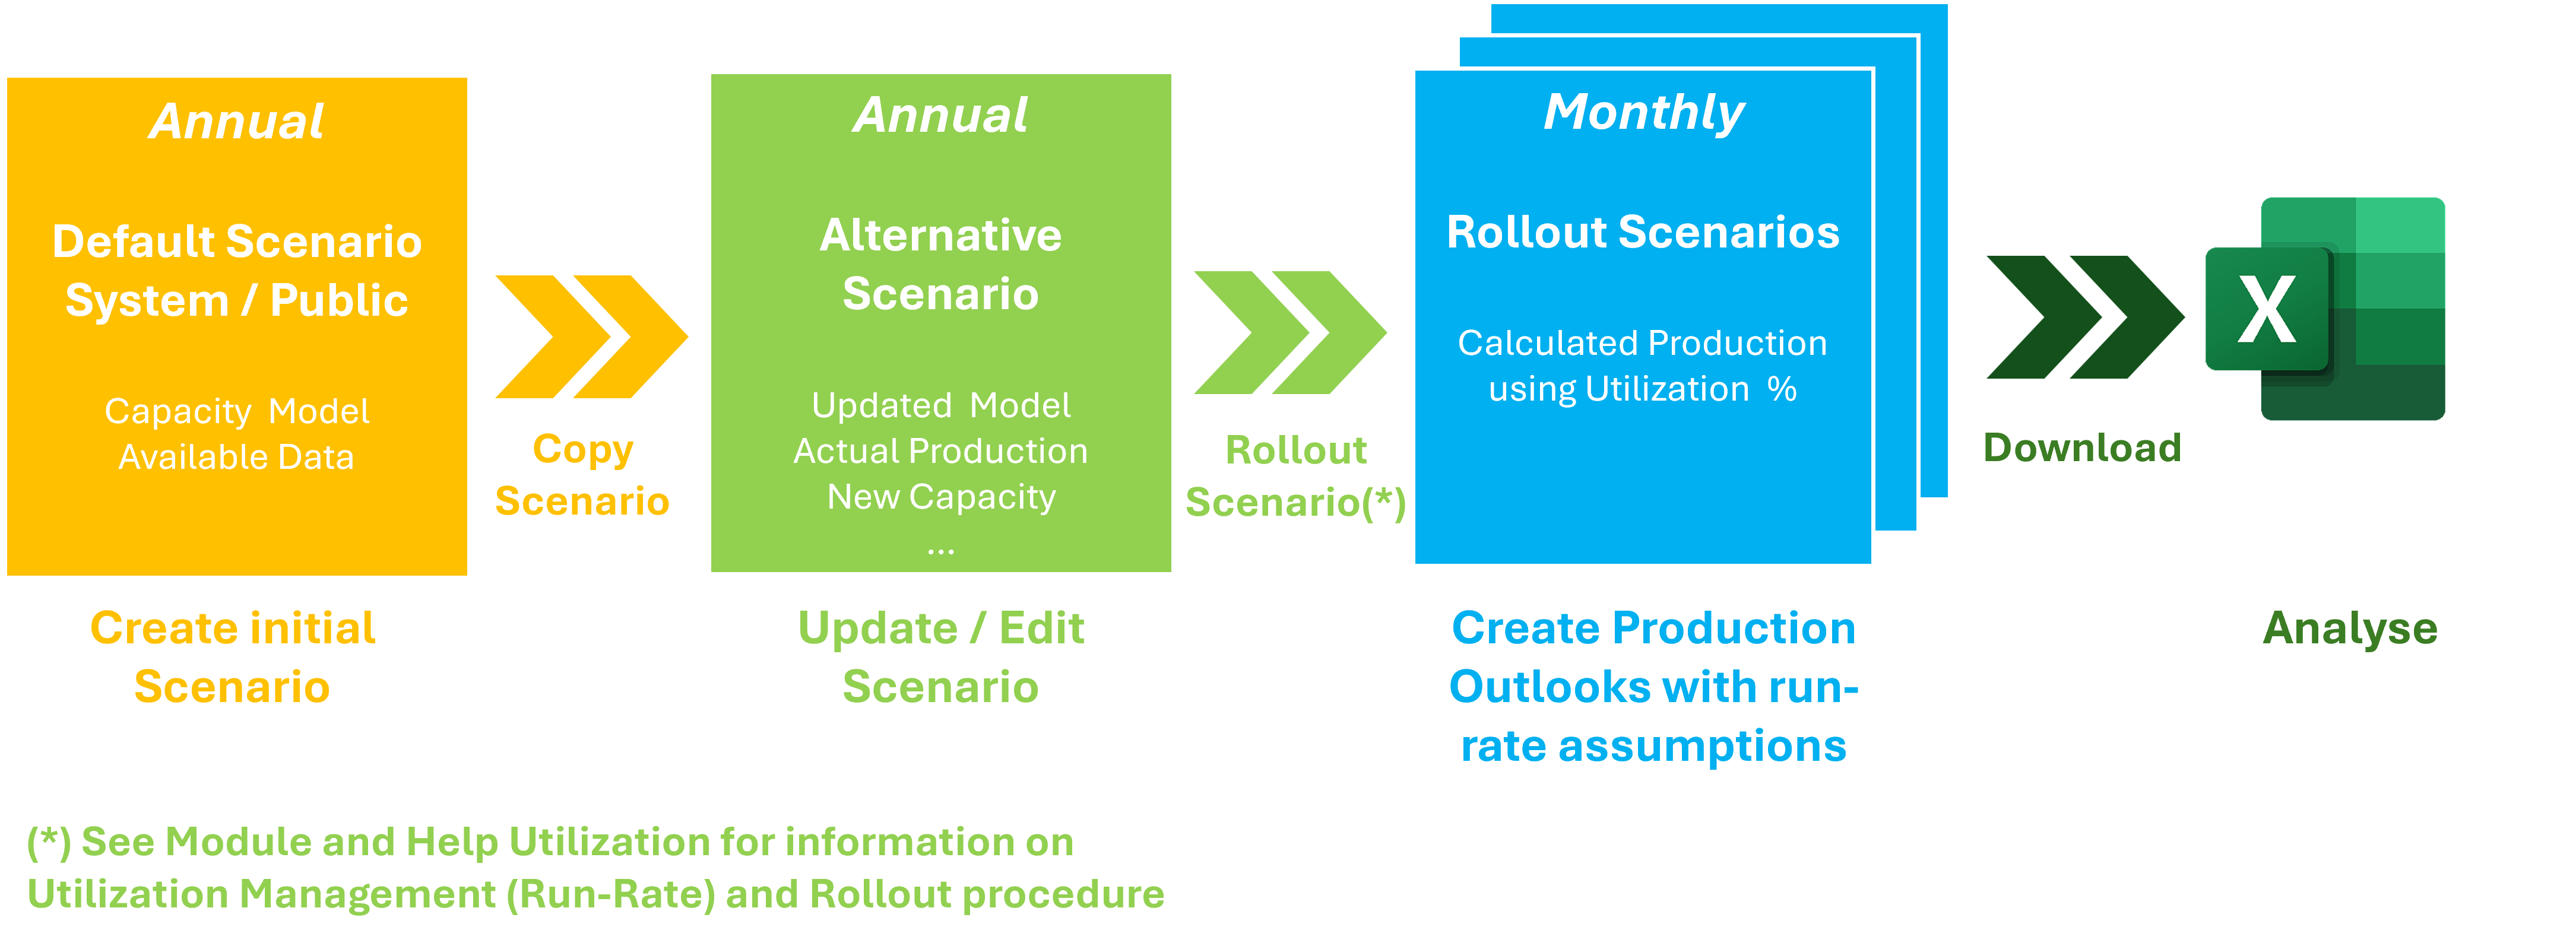
Scenarios allow a very flexible data modelling. ppPLUS differentiates between Annual Scenarios and Monthly Scenarios.
| Category | Annual | Monthly | |
|---|---|---|---|
| System/Public | Any | Any | |
| Purpose |
|
|
|
| Data creation / editing |
|
|
|
| Period: Year |
Virtual Year Not visible, not relevant |
2020 - 2040 Other periods can be made available |
2020 - 2040 Other periods can be made available |
| Period: Month | Not relevant | Not relevant | 1 - 12 |
| Planning Base |
|
Available for rollout and copy | |
| Visualization | Available | To be implemented | N/A |
Scenarios will allow to model and analyse data on multiple levels. Annual Scenarios can be used as Base Scenarios for Roll-Out using Utilization Rates.
All publicly available information and data is captured in the public Scenario Public/System.
Data can be protected in Scenarios, created for other Clients.Mass Balance models of existing, public operations can be copied to other public Scenarios and to other Clients, where the Scenaro can be made public or protected.
ppPLUS provides the possibility to model Site Mass Balances with alternate Configuration-Scenarios. This allows to
create and analyze the performance with varying configurations.
Herefore the existing (Public/System) Scenario is copied into a new Scenario. Assets can now be added to the Site, either replacing
or as additions, allowing to change the configurations.
With that, Assets can be modelled with alternative configurations and yields.
Forward planning can be simply achieved, by creating future monthly Utilization-Rates and rolling out the Scenarios.
This will calculate future outputs (by month) by multiplying Capacity * Utilization-%. The Utilization allows to model
variances to the capacity (or any source Scenario), like Shutdowns, strategic factors etc.
The Mass Balance Chart displays, in Metric Tons per Annum, the Imports and Outputs of a Site
The View summarizes in 2 Charts the Imports of a Site (Feedstock, Products, Utilities) and the Output (Products and Utilities). The quantities are summarized on the top and the central box is indicating, if the Site is balanced. Select from the Navigation-Bar to view or model Imports, Production or Consumption.
With the Import-Function Feedstock (Raw Materials) are imported into the site for consumption and processing. Any material (raw materials), which are coming from outside need to be imported through an Import Asset.
The Units of the Import Asset can link to an external Supply-Site.
Listing of the Imports, which are consumed in the process in the source Unit of Measure as entered, by Site.
The list shows the imported products by Asset and the consumption of the product in the Comsumption Asset.
Select from the Navigation-Bar to create new Imports, or view/model Production or Consumption.
Create new Imports for processing in the Site. The View is designed to enter values (quantities) as they are provided in the source documents, particularly for the Unit of Measure and the Time-Rate.
Import Assets/Units are typically logistic assets of an operation or a virtual Asset. The dropdown only lists Assets which have been categorized as "Import" in the Asset module.
Consumption (processing) Assets/Units can be any (Non-Import) Asset created for the Site.
Any product can be imported into a Site. Select the Main-Product and the related Sub-Product.
Quantity can be a volume or mass of imported Products and is defined by the Unit of Measure dropdown.
ppPLUS offers a number of different units for quantities consumed. The default UOM is linked to the property in Main Product Master and can be overwritten.
Consumption rate Hourly/Daily/Annually
For explanations on the Visualization, go to Visualization.
The Production function models the production of intermediate- or final-products.
Lists the Production by selected Asset.
Create Production of either intermediate or final Products.
Select Asset, which has been categorized before as "Processing Asset".
Select/Search Main-Product and linked Sub-Product.
Quantity can be a volume or mass of imported Products and is defined by the Unit of Measure dropdown.
ppPLUS offers a number of different units for quantities produced. The default UOM is linked to the property in Main Product Master and can be overwritten.
Consumption rate Hourly/Daily/Annually
For explanations on the Visualization, go to Visualization.
Production entries can be deleted from the Production-List. Select Details and then Delete from Navigation Bar.
Consumption models the processeing of intermediate Products. ppPLUS differentiates between several categories of Consumption:
The Supplying Asset is a different Asset than the Consuming Asset.
The Supplying- and Consumption Asset is the same.
This transaction creates automatically the matching Production. This Consumption-Transaction cannot be edited
individually.
Process-Transactions also allows to add additional information to the process.
Create Consumption entries of either raw materials or intermediate Products.
Products can only be consumed, which have been produced by a Supply- (Production) Asset. Only existing outgoing Products will be displayed.
Select Asset & Unit, which has produced the incoming Products.
Select Asset & Unit, which are consuming the outgoing Products.
Quantity can be a volume or mass of consumed Products and is defined by the Unit of Measure dropdown.
The system will not check, if sufficient quantities for Consumption are available.
ppPLUS offers a number of different units for quantities consumed. The default-UOM is linked to the property in Main Product Master and can be overwritten.
Consumption rate Hourly/Daily/Annually
For explanations on the Visualization, go to Visualization.
Product Consumption shows all the Consumption entries by product.
Asset Consumption shows all the Consumption entries by an Asset.
Indicators allow to assign values to a wide variety of performance categories, like Nelson Index, Employees, CO2-Neutrality, etc. For each Indicator the Unit of Measure is defined and the period.
Indicators can be categorized into: Entironment, Finance, Information and Performance
KPIs can be defined for individual levels of organization. (Currently only level Site is operational)
Unit of Measure for Indicators can range from a number (Integer) to quantities (Barrels, Tons, ...).
Indicators can be set and presented as a scale, with Minimum- and Maximum Value. The defintion of the Top- or Botttom- as well as Medium Value can be described in the Descriptioin Fields
Definition and Formula of the Indicator.
Link to external site or document, explaining the KPI.
Report lists all Imports into Sites. The Report can be filtered, to allow various analysis, like Refining-Processing-Capacity.
Links open the site for Imports of a particular Site, or show details of the Product.
Entities and Sites Imports will be included, if they meet below criteria:
Report lists the Production of intermediate- and final products by the Sites. The Report can be filtered, to allow various analysis, by Country, Product....
Link opens the Mass Balance Production.
Entities and Sites Production will be included, if they meet below criteria:
The Hydrogen Module combines all the elements of ppPLUS related to the Hydrogen Product-Family (Main-Products: Hydrogen, Ammonia, Syngas) and the Hydrogen Value Chain.
The Module-Page shows the details of the Hydrogen-, Ammonia- and Syngas product and links its Products. Select from the Navbar, which product-details you would like to see. The Technologies listed on the right are relevant for all 3 products.
Hydrogen is also defined as a Building Block product and a range of products is a part of the Hydrogen-Value-Chain, listed in the table.
The module lists here all the technologies, which are modelled for production processes in ppPLUS. More technologies may already be included
in the Technology-List, but not yet applied in a Site-Production-Model.
The Technology-Details show all the Assets (Plants), where the Technology has been deployed.
The report shows all the production in the system of Hydrogen, Ammonia and Syngas.
The report can be filtered by Products (Green-, Blue-Hydrogen, etc) and Country. Select the Geo-Marker, to view ALL the manufacturing locations of the product.
Alternatively you can select the Hyperlink under Site to view directly the Production-Table of the Site, providing furhter details, also on the Technology used.
The Communicator includes all Communicator Entries, which are linked to Hydrogen, Ammonia and Syngas products, and Sites which produce these products as well as Technologies, which are deployed in these Sites. The table also shows all Communicator entries which contain the hashtags: #hydrogen, #ammonia or #syngas.
Entities and Sites Production will be included, if they meet below criteria:
The Sustainability Module concentrates all data and activities around the initiatives of the industry to implement initiatives of the Energy Transition.
The Communicator shows all messages and updates with the category "Sustainability" and hashtags "#sustainable"
The Map and the Table categorize and list the Sites with an Sustainability Indicator.
| Indicator | Description | Rating | Rating | Rating |
|---|---|---|---|---|
| Operation is using renewable feedstocks or replacing in part Hydrocarbon feedstocks | Implementing initiatives to move to introduce Bio- or other renewable feedstocks, like waste recycling | Partial usage of renewable feedstocks | Significant or complete usage of renewable feedstocks | |
| Rating the extent of the usage of renewable energy in the processes | The operation's' energy is starting or planning to use energy from renewable sources | The energy consumption of the operation is coming from renewable sources | Operation is utilizing significant amounts of energy from renewable sources | |
| Valuation of the processes for efficient methods to reduce CO2, like circular processes and other | Implementing initiatives to move to introduce Bio- or other renewable feedstocks, like waste recycling | Parts of the operation apply circular processes or other efficient CO2 reducing measures. | Complete circular system or the company has implemented initiatives which are an example in environmental efficiency. |
Solutions - The Market Place for Services and Products by ppPLUS Partners for the Industry.
Contact ppPLUS to enter into an agreement, allowing to create Solutions on the platform. Once the agreement is signed, your status will be "Expert" and giving you access to a Media Container, to store your documents and images required to describe the Services you are planning to offer.
Create your first Service from your Expert-Profile ![]()
Select the appropriate Categories and an Industry, if your Services are especially targeted at a specific industry.
Provide summary description of your Service. This is the first information potential customers can see. Maximum of 300 characters are available.
Provide a detailed description of your services in a free format. This can include links, lists, tables, images. Maximum of 10000 characters available. Images: Upload images in your Media-Centre and copy the link, using the Image-Icon in the taskbar of the description-field.
If no image-link is provided, a default image will be displayed. But it is highly recommended, to generate an image which visually describes your service and differentiate it from the others. ppPLUS is recommending to use the same image-size as LinkedIn is using for articles: 1200 x 644 pixels
A Video can be added to the Solution via uploading to the Media-Container and pasting the link into the field. Contact the SysAdmin, if the video-size is too big.
PDF Files linked here, best from the Media-Container can be added here to provide additional information to the customers.
The Keywords, or short sentences in this field are visible with the Service and used for first searches. It is important to specify here clearly what your Service offers, where it can help.
Solution Services can be directly linked with ppPLUS Objects: Entities, Technologies, Main Products. Others Objects will be included later.
The Details Views for these Objects provide the Object-Reference, which needs to be copied into this field.
Users of ppPLUS can check directly from an Entity, Technology or Main Product, if an Originator is offering a Service especially for this Object.
The format is hashtag/Object-Abbreviation/ObjectID, examples:
Each Detail-View provides the Reference-Code needed in the Solutions Icon
2 Fields to provide a description, how your Service can support the customers. This is only an internal field to help the Search function.
Internal field for Clients to link the ppPLUS-Product/Service-ID with your internal ID for admin purposes.
Refinery Analysis provides a comprehensive picture on their processing capacities and their Nelson Complexity Index.
Entities and Sites Imports will be included, if they meet below criteria:
The Notification Board provides an overview of reactions to your Communicator Messages or when you have been mentioned.
Share your expertise on companies, technologies, products, and processes with a global community of professionals.
Information is seamlessly linked to objects, offering a fully integrated view for efficient research and analysis.
Use direct messaging, @mentions, and hashtags to interact with others, rate contributions, and build visibility.
Get in touch to explore how your contributions on ppPLUS can generate value.
Objects mentioned in the overview refer to these modules in ppPLUS:
Object-References "#XX123" are shown on the Module-Details View
Corporations
Entities
Sites

Technologies
Technology Types

Products
| Communicator |  Insights Insights |
|||
|---|---|---|---|---|
| Object Messages | General Message | Object Articles | General Articles | |
| Primary purpose | Short updates on objects | Direct Messages (DM) or general short messages | Reports and analysis for complementing data on objects | General articles, analysis and studies |
|
Object linking See also Object-ID/Feed |
Single Object only | N/A | Multiple Object-Linking possible | |
| Required user rights |
Collaborator (without image uploading) |
Modeler with Expert-Level | ||
| Functionality / Application | ||||
| Initiate from | Communicator function in every object-view |
New Message-Button on Homepage or "Create Direct Message" in Notification Board | Insights-Icon on selected object-views |
Actions-Menue in Expert-View |
| Appearance | Popup-Dialog and Full-View |
Full-View | ||
| Editing | Limited HTML-Editing | Expanded HTML-Editing with possibility to save as draft |
||
| Images | Experts can upload image for placement in Text-Body |
Recommended to upload a Title-Image Additional Images can be embedded in the Article-Body |
||
| User Benefits | ||||
| Monetization ($) | N/A |
Donation scheme available With activated "Authorize Donations" in User Profile |
||
|
Badge Points (Beta-Status) |
Yes | N/A | Yes | |
| # @ - Interaction | ||||
| # Hashtag proposals | Yes | Yes | ||
| @ User Notifications | Yes | In Comments only | ||
| Threads (Comments) | Yes | Yes | ||
| Likes/Agree, Disagree | Yes | Yes | ||
| Object linking and appearance in feeds | ||||
Message Categories


| Corporations, Entities, Sites, Products | N/A | N/A | |
| Object-ID | Stores ID from object generated | N/A | Stores by default reference-ID from object generated. (See also Object Feed) |
Object-references for appearance in Object-Insights can be added. No hard-link to an object on Homepage. |
| Homepage Feed | With activated "Show on Homepage" |
With activated "Show on Homepage" N/A for Direct Messages |
With activated "Show on Homepage" |
|
| Object Feed | Communicator-Feed | N/A | Default inclusion on Insights-Feed of object. Add reference-IDs (#XX123) to include in other feeds |
Add object references manually to include in targeted Insights-Feed |
Do not use the Communicator (Object or DM) or Insights for private/confidential messaging.

Communicator
Add Message