

Product
Product Models
Insights
Solutions
- Product
- Carbon Black
- Names
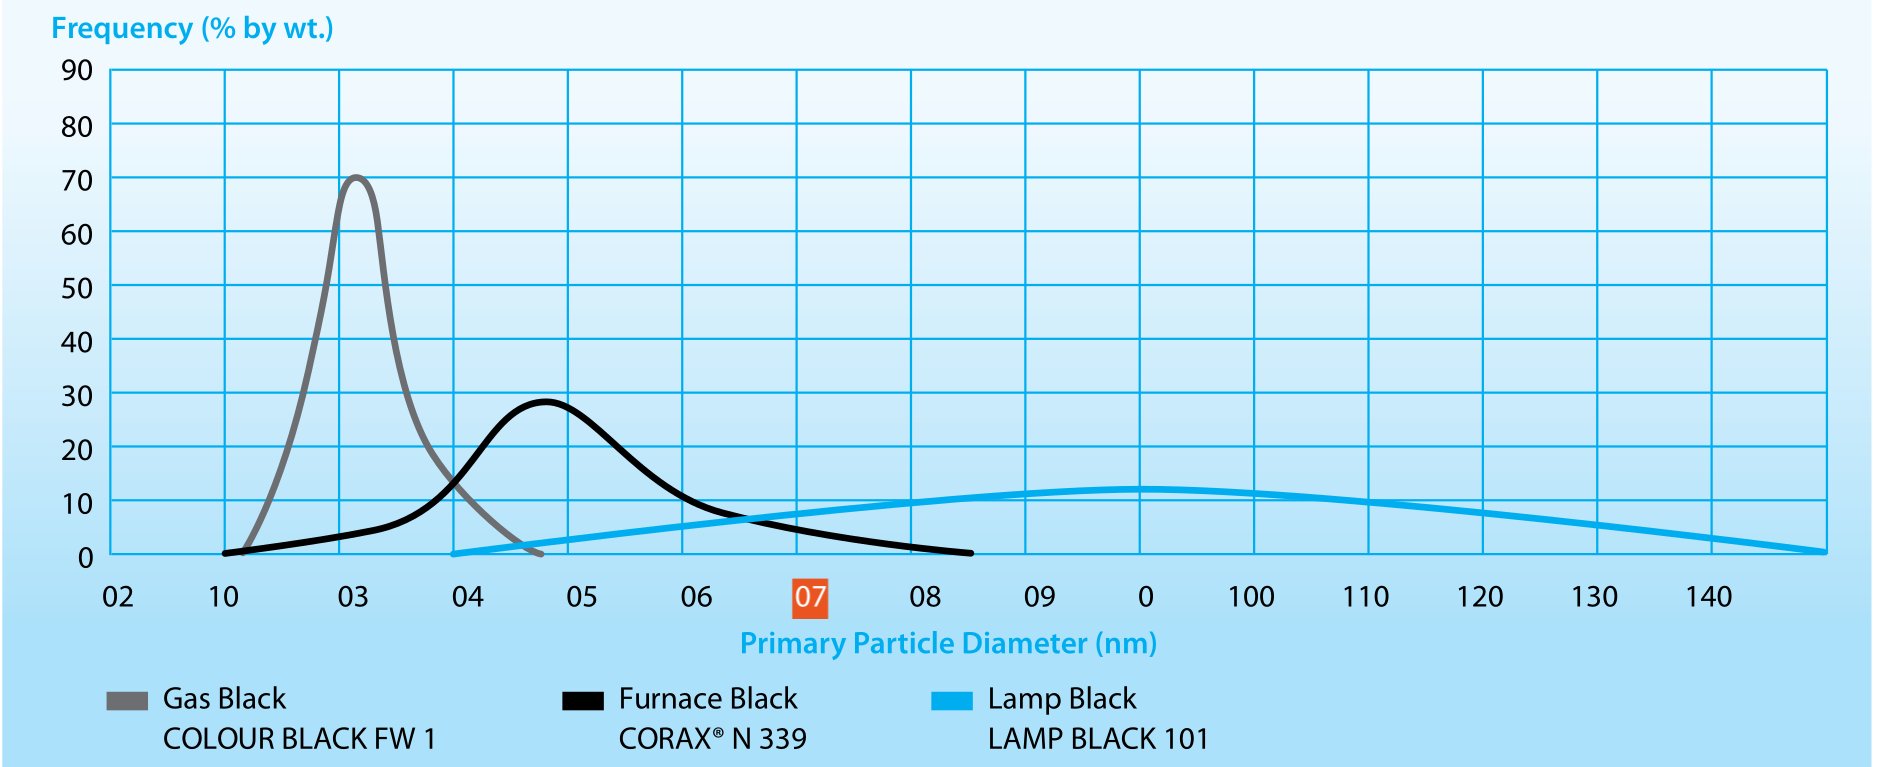
- Carbon Black (amorphous); Furnace Black; Acetylene Black; Channel black; Thermal black; Lamp Black; Gas Black
-

- #PS582
- Main Product
- Carbon Black
- Segment
- Refined Products
- Main-Family
- Refinery Residues
- Sub-Family
- Coal & Petroleum Residues
- Physical State
-
Solid
Description
Your insights will be shown here

Carbon Black https://www.carbon-black.org/
Product Communicator
| Title | Date | |
|---|---|---|

|
6/29/2024 |
Identifiers
-
 CAS Number
- 1333-86-4
-
 EC Number
- 215-609-9
-
ECHA InfoCard
- 100.014.191
Chemical Data
- Specific Gravity
- 1.80
Crude Data
- API Gravity
- -52.89
- Country
Product Settings
- Default
- Status
- A
Content provided by
| Transaction | Name | Date |
|---|---|---|
| Modified by |
|
6/30/2024 4:18 PM |
| Added by |
|
6/29/2024 9:01 AM |