The new podcast from ppPLUS. Join industry experts finding strategies for today's challenges.
The new podcast from ppPLUS. Join industry experts finding strategies for today's challenges.
The new podcast from ppPLUS. Join industry experts finding strategies for today's challenges.
The new podcast from ppPLUS. Join industry experts finding strategies for today's challenges.
The new podcast from ppPLUS. Join industry experts finding strategies for today's challenges.
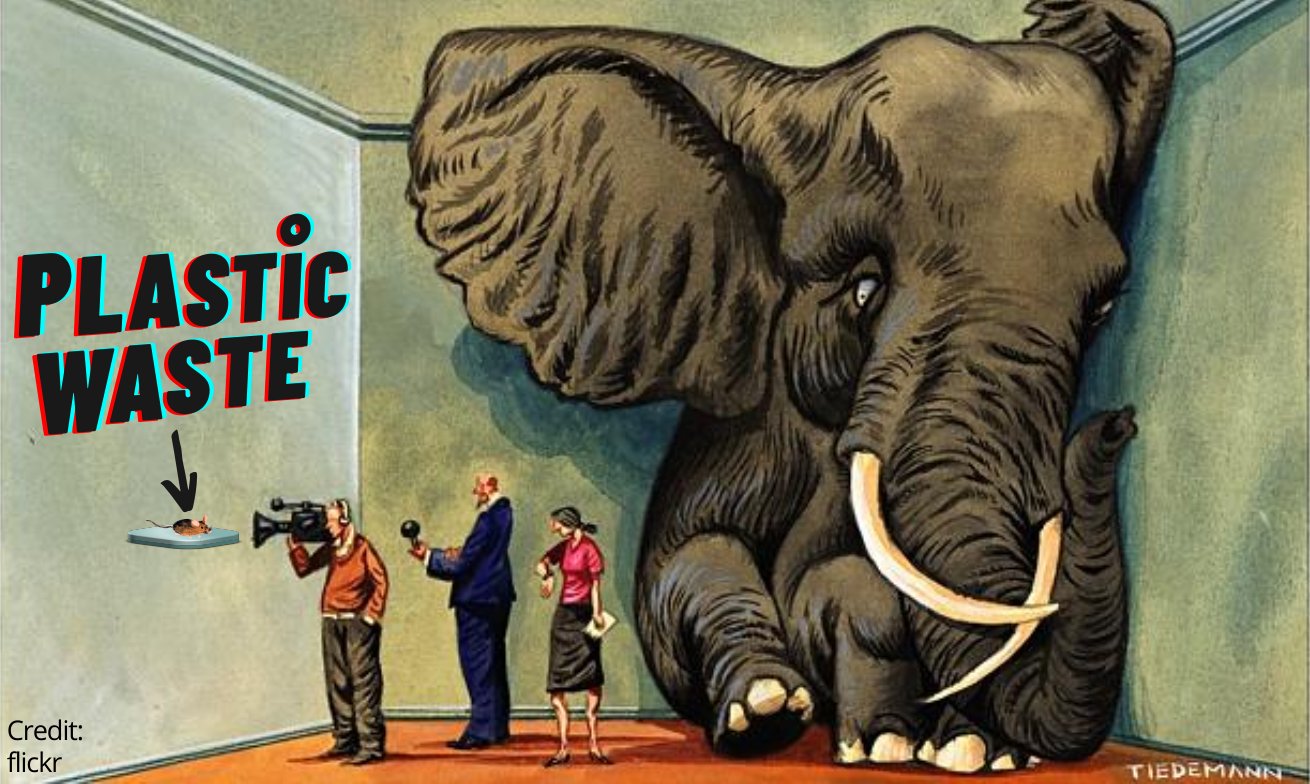
The planet is on fire because we are burning plastics, there are millions - or perhaps billions - of tonnes of plastic that accumulate in the oceans, plastic waste takes hundreds or maybe thousands of years to degrade or possibly never disappear, it is raining plastic particles that are everywhere in the food we eat so that we are eating plastic for dinner, there will soon be more plastic than fish in the oceans, plastics exterminate marine animals, cocktails of toxic additives in plastics intoxicate the food we are eating that is killing us, plastics release toxic combustion products that pollute the air we breath and destroy our health, do I forget any thing here?
But wait a moment. What quantities are we actually discussing?
The fact is, we know—quite precisely.
Chart 1: Passage of fossil fuel feedstock through the chemical industry in 2017 [1]
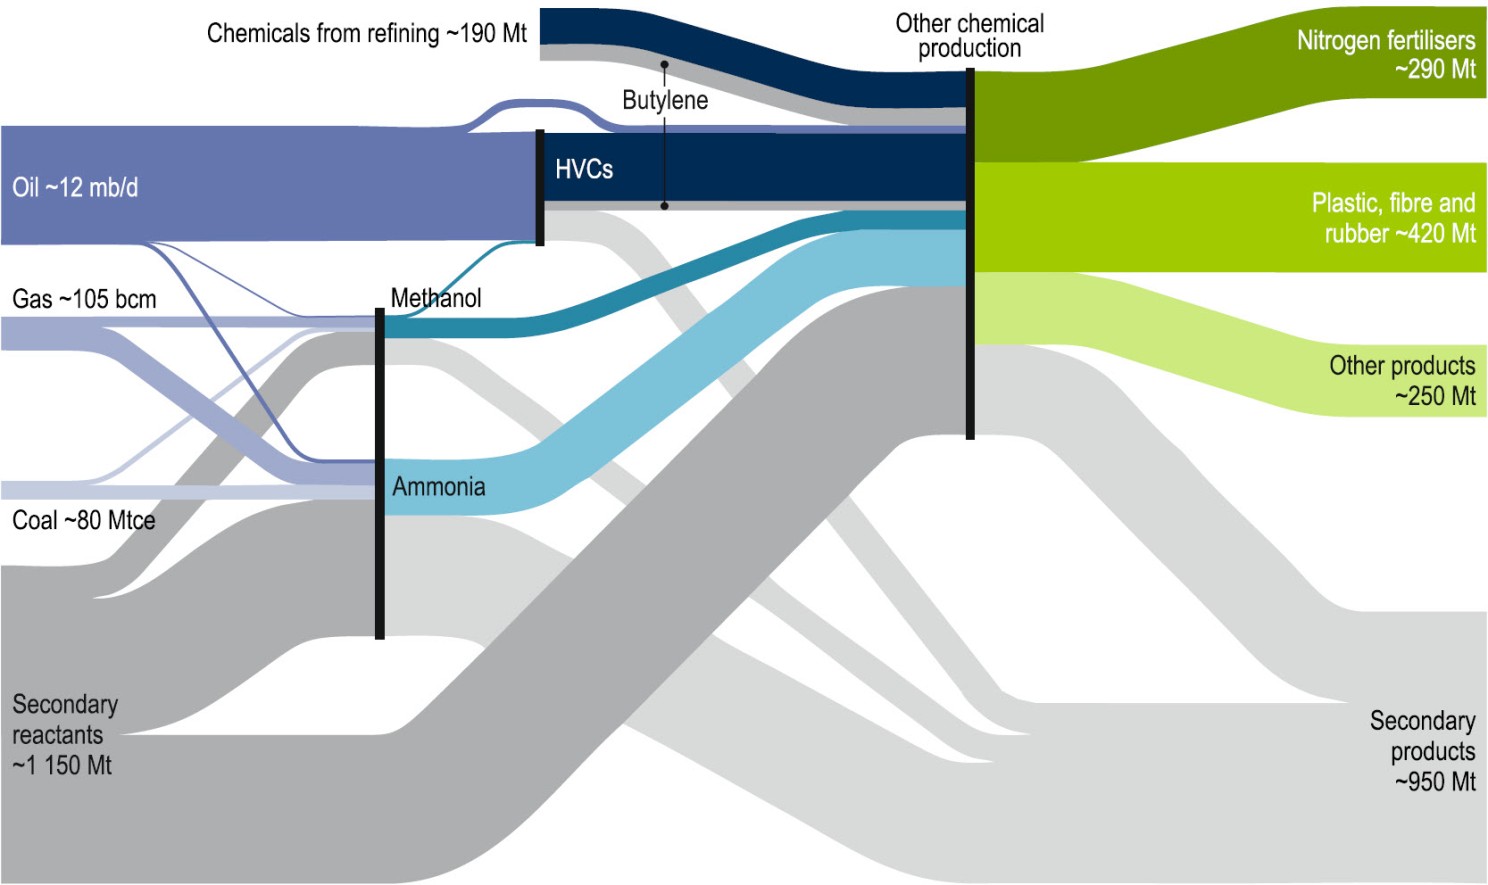
All synthetic plastics, fibers, and rubbers totaled 420 million tonnes in 2017.
The figure sounds substantial—enormous, even monumental.
But is it?
How does this compare to global material consumption?
Chart 2: Global Materials Demand [2]
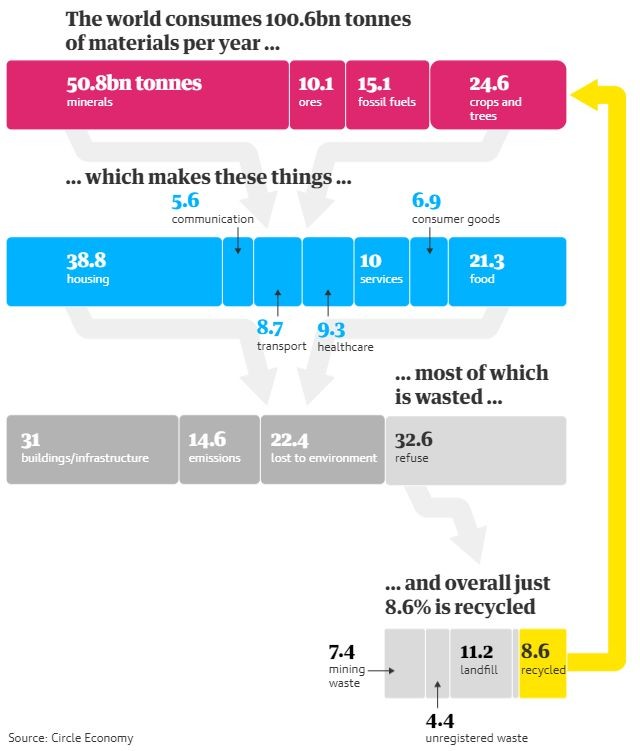
The world consumed 100.6 billion tonnes (100,600 million tonnes) of materials in 2017.
Therefore, all synthetic plastics, fibers, and rubbers represent 420 / 100,600 = 0.4% of the total.
Less than half a percentage point—this is plastics' share of annual consumption relative to minerals, ores, fossil fuels, crops, and timber.
Plastics are derived from fossil fuels—oil, gas, and coal—of which the world consumed 15.1 billion tonnes (15,100 million tonnes) in 2017.
Here again, plastics account for only 420 / 15,100 = 0.028, or 2.8% of annual fossil fuel production.
Less than 3% represents plastics' share of annual fossil fuel demand—approximately 5% when production energy requirements are factored in[1].
One could argue—and many do—that plastic waste pervades the ecosphere: invading environments, contaminating soils, clogging waterways, polluting oceans, and degrading air quality. In short, plastic appears to be the only waste that matters because it is the only waste we notice.
While comprehensive global statistics may be unavailable, data from the United Kingdom provide perspective.
Chart 3: Waste generation by waste material, United Kingdom, 2016 [3]
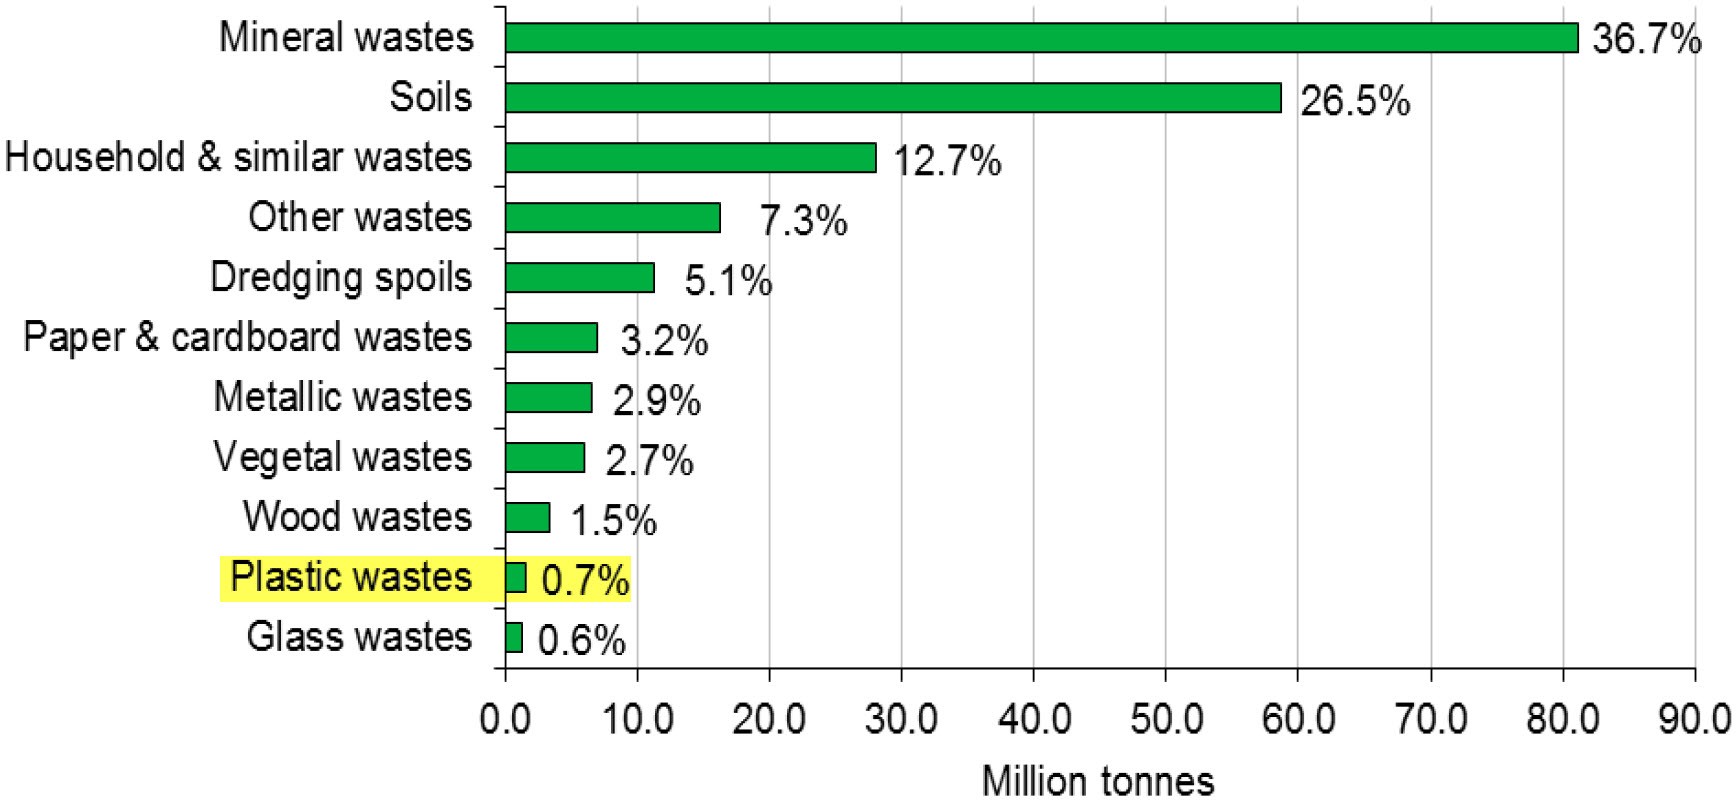
Plastic waste represents just 0.7% of all waste generated in the UK annually, a proportion reasonably representative of the global average.
This is 4.5 times less than paper waste, which demonstrates a significantly more detrimental carbon footprint according to numerous life cycle assessment (LCA) studies, including 18 reviewed on the Plastics Paradox website [4].
Finally, plastics are frequently cited as contributors to global warming through CO₂ emissions from waste-to-energy incineration.
Let us examine the calculations:
To be clear: if all synthetic polymers produced annually were incinerated, they would add only 0.145 ppm of CO₂—or 0.035%—to the existing 414 ppm in the atmosphere.
This calculation precedes consideration that only approximately 12% of plastics produced globally are incinerated annually—a figure frequently cited by environmental advocates. Conversely, this means 88% of used plastics are not burned, reducing actual emissions from plastic incineration to 0.145 × 12% = 0.017 ppm.
To reiterate: "the alarming amount of plastic that is burned" annually contributes 0.017 ppm of CO₂ to the atmosphere. At this rate, it would require 58 years to add a single additional ppm of CO₂ to the atmosphere.
Surely this warrants serious concern?
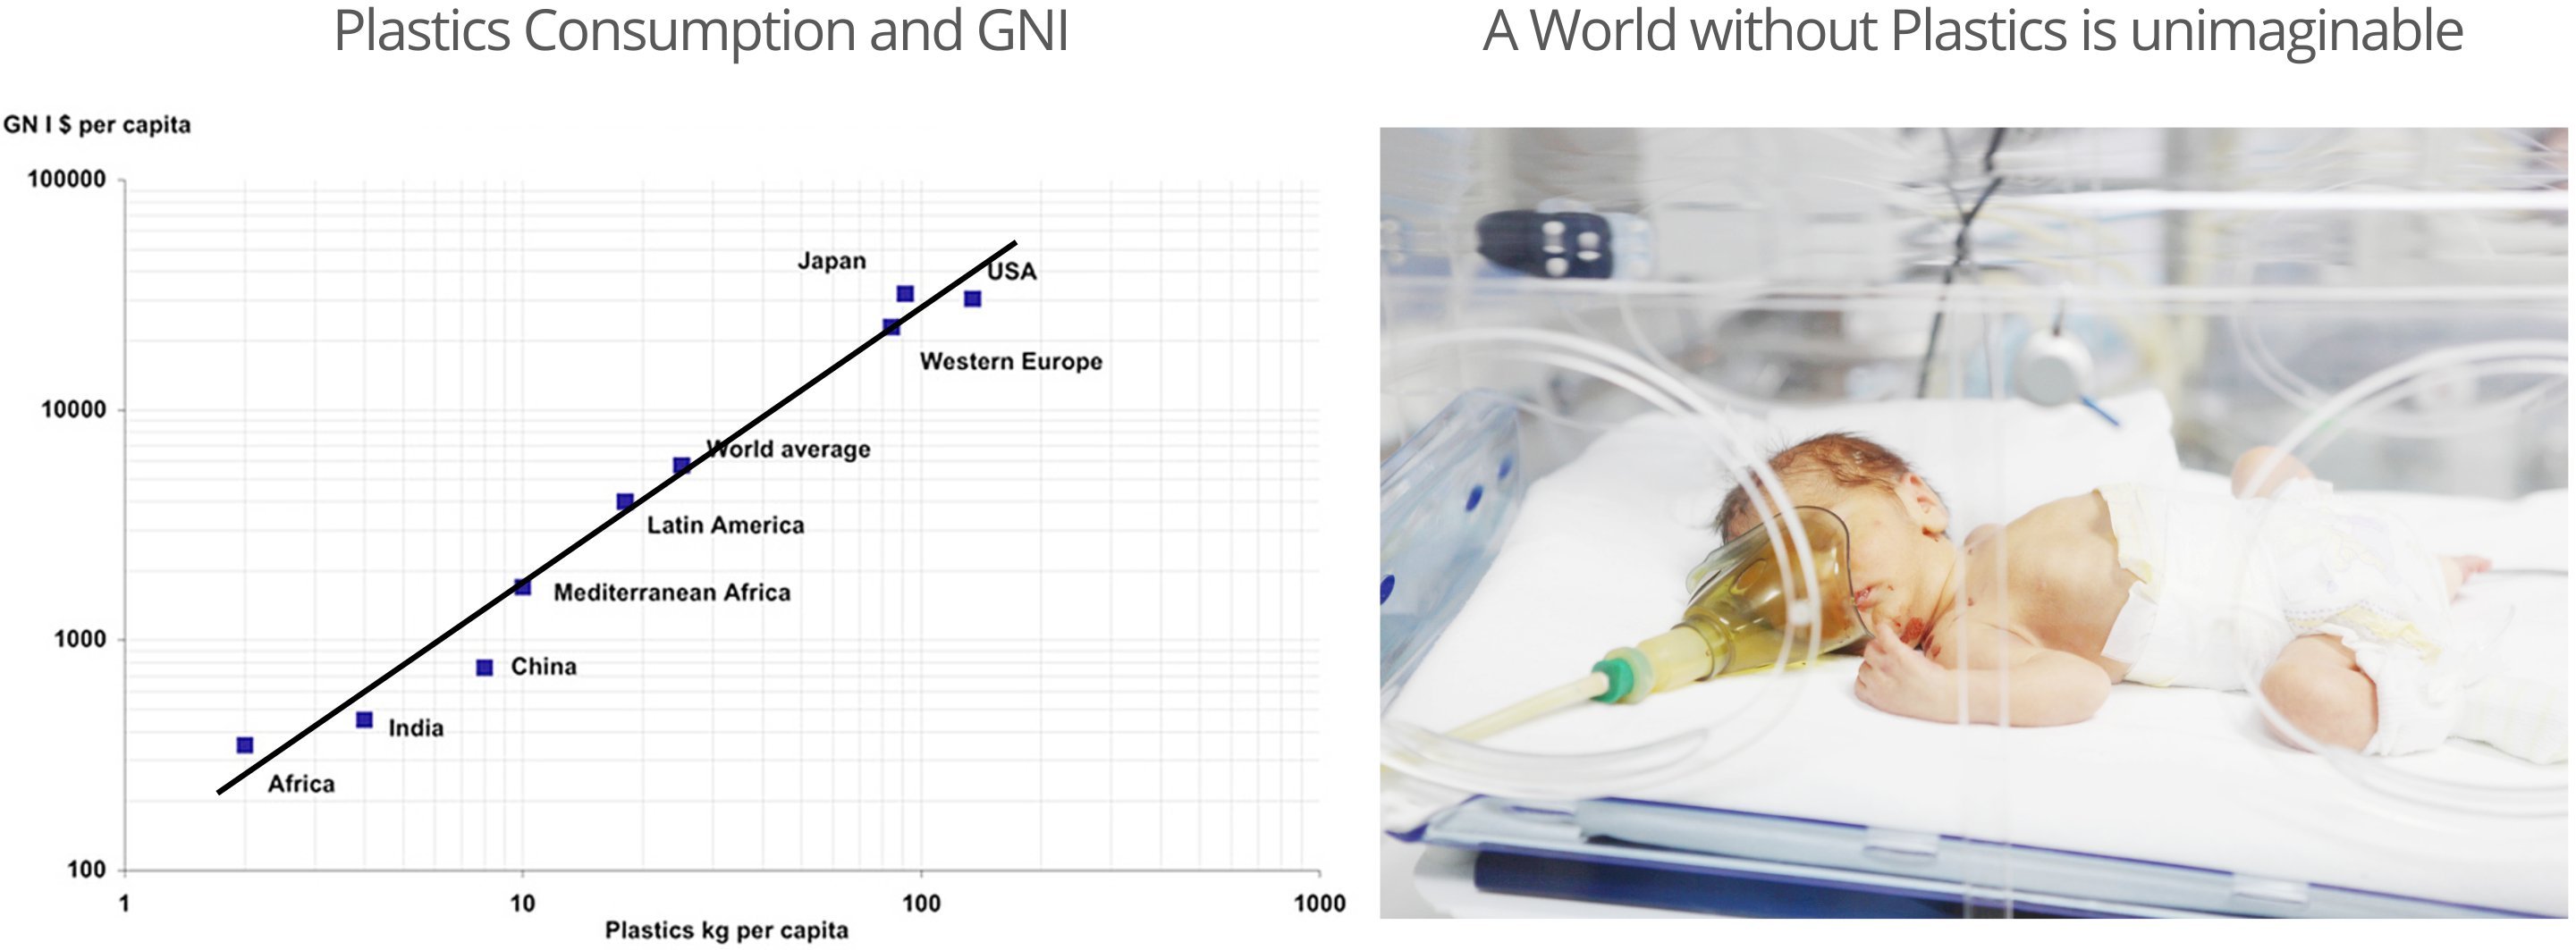
The reality is that plastic consumption correlates with progress. The more economically developed a country (measured by GNI per capita), the higher its per capita plastic consumption (on a log-log scale) [8]. Plastics represent a technological achievement delivering invaluable services to economies and populations worldwide. They have contributed disproportionately to human flourishing, economic growth, health improvements, and wealth generation. A world without plastics is unimaginable—modern society could not function in their absence. Therefore, resist the alarmist, agenda-driven propaganda of anti-plastic campaigners. I remain unmoved, and you should too.
Chart 4: Plastics Consumption: a Hallmark of Progress [4]
_______________________________________________________________________________________________________________________________________________________________

Communicator
Add Message